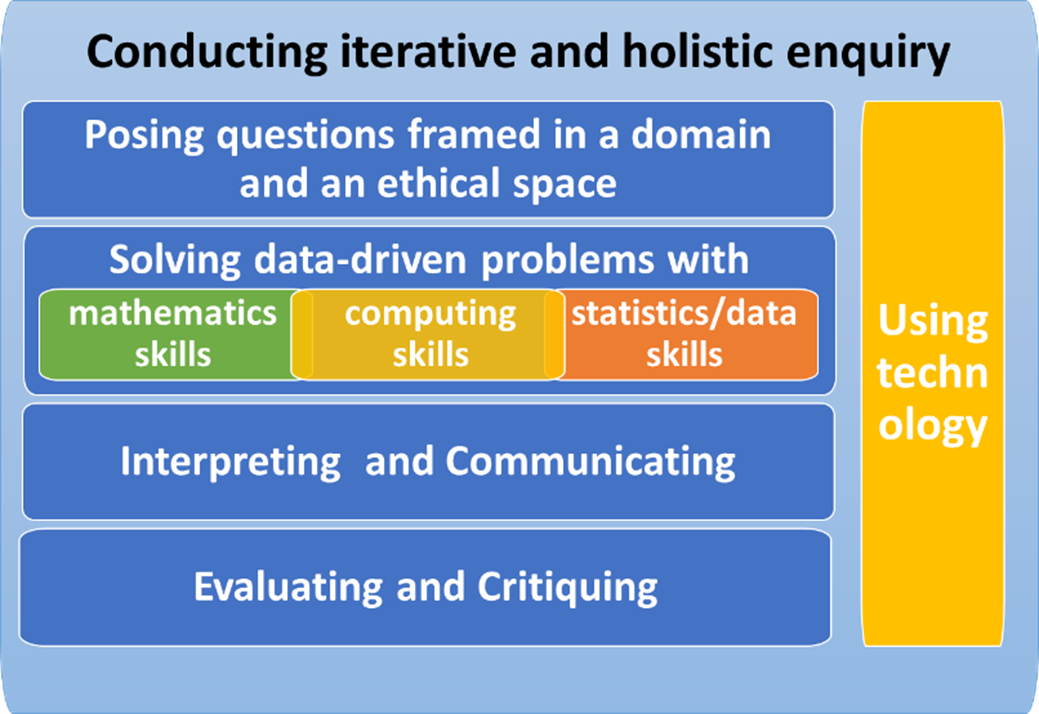
Mathematics Education researchers at the Open University have recently been working on ideas for bringing data education into the school curriculum and making sure it has a good foundation in mathematics, statistics and technology [i]. On 29th June we held an online event for schools that put some of these ideas into practice. This was part of our work on the Opening Up Maths project, aiming to encourage more people to consider studying mathematics.
We were particularly inspired by some of the thinking behind the Royal Society’s Mathematical Futures report [ii], such as this statement:
“Future citizens in all walks of life will need generic, transferrable mathematical competence to underpin their occupation-specific techniques and skills, and to support daily life.”
We agree and we think that current citizens also need those mathematical competences. We know that teachers work hard to give their learners mathematical skills that help them pass their GCSEs and equip them for life. But, as one of our PhD students (herself a secondary maths teacher) is finding out [iii], teachers also need time and experience to be able to share how maths is used in workplaces outside school.
Our event was designed to support teachers by providing examples that we had designed to work in a school setting. We used the university’s industrial and academic contacts to invite five speakers to share how they used mathematics to solve a real problem at work, each in a tight 25-minute slot. We advertised the event using our schools network and 25 classes attended remotely during the day, mostly Year 9 or 10.
These are the five topics we covered in 2026, most with a live presenter explaining their work.
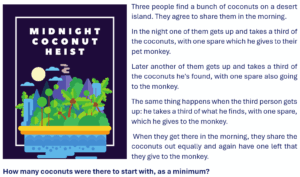
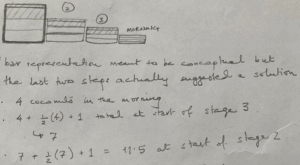
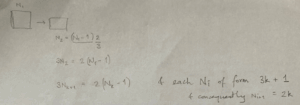
Seeing the maths & stats in Outdoor Activities 🧭 told the story of using maths to work out where to position check-in posts for different routes and times on an outdoor expedition.
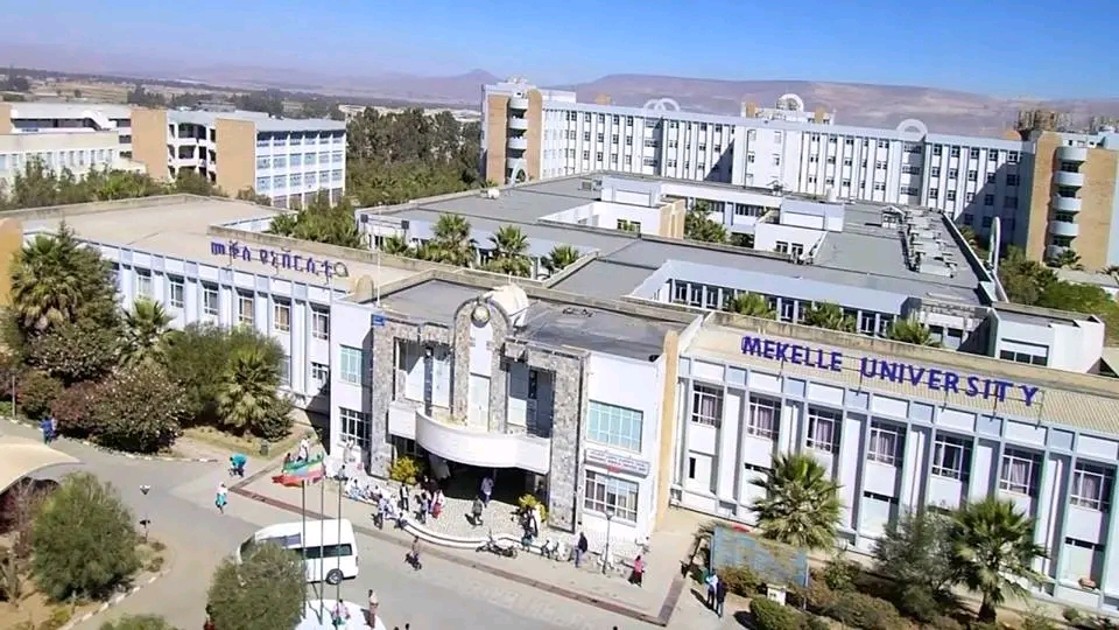
Mekelle University, Ethiopia, analysed health data with the OU
Seeing the maths & stats in Healthcare⚕️explained the problem that some pregnant women can find out they have the illness diabetes when it is already too late to take action. By collecting and analysing healthcare data from nearly 12,000 women, Open University researchers created a mathematical equation and built it into a tool that doctors and mothers can use to predict risks and make decisions much earlier in pregnancy.
Seeing the maths & stats in Publishing 📖 opened our eyes to balancing quality and costs in publishing textbooks and linked the GCSE topic percentage increase with the business idea of percentage profit margin.
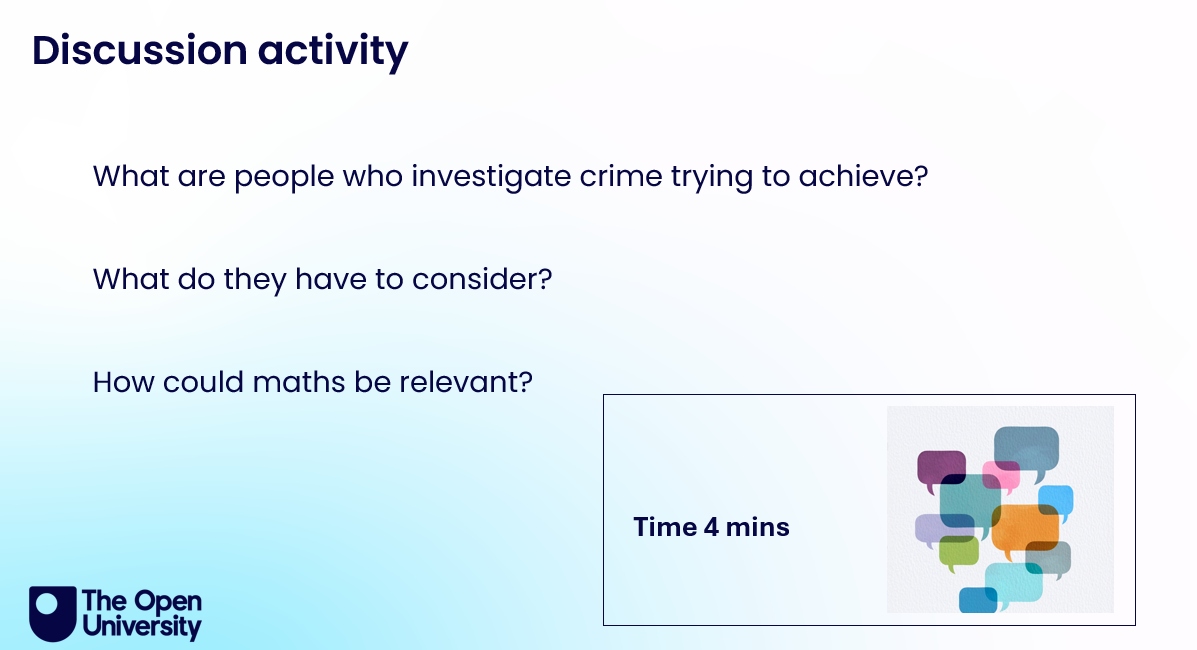
Seeing the maths & stats in Chasing Fraud 🥸got us looking at bank statements to identify unusual patterns of spending, and explained the importance of a clear, labelled graph to communicate evidence to a judge and jury.
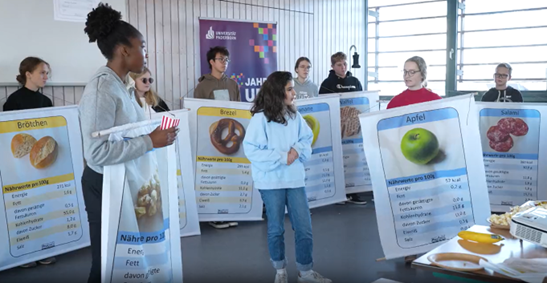
Finally, Seeing the maths & stats in Supermarkets 🛒 made us think about how supermarket chains decide where to build new supermarkets, and decide which supermarkets are performing well. Being able to read a scatter graph and understand a line of best fit were skills for this kind of work.
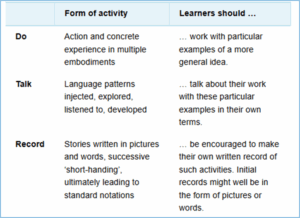
One of the most important parts of our session design was that learners would be given time to understand the context and the problem before meeting any mathematics. Our work has emphasised that mathematical and data education cannot simply treat real-world contexts as background to mathematics [iv]. Teenagers are learning about the world as well as using maths in the world. As The Royal Society report says, “General quantitative literacy includes real world problem solving where understanding the problem, data collection, mathematisation, performing calculations, and communication of results are all important.”
In each online session, there are regular pauses for discussion time with questions for the class to answer. The class teacher organises a short discussion and then types the class’s ideas into the chat. Feedback from teachers suggests it would be helpful to record the sessions. Partly this was to allow even more classes to take part and also because they had valued the discussion and would have liked to build this into a full lesson. We will consider the privacy/safeguarding aspects, and are likely to allow that next year.
If you are interested in taking part in future events – either as a speaker or as a teacher with your class, do get in touch by emailing our Outreach team at [email protected].
Written by Cathy Smith, working with the OU Maths & Stats external engagement team Kellee Patterson and Ellen Marshall.
Our sources
[i] Kathotia and Smith (2026) https://www.jmc.org.uk/2026/02/12/rapid-review-of-data-education-within-mathematics-5-16/
[ii] The Royal Society (2024) https://royalsociety.org/-/media/policy/projects/maths-futures/mathematical-and-data-education-policy-report.pdf
[iii] Kerrison (2025) https://bsrlm.org.uk/wp-content/uploads/2025/05/BSRLM-CP-45-1-5.pdf
[iv] Smith et al. (2023) https://royalsociety.org/-/media/policy/projects/maths-futures/intersection-mathematics-data-statistics-computing.pdf